Data Analysis Tableau
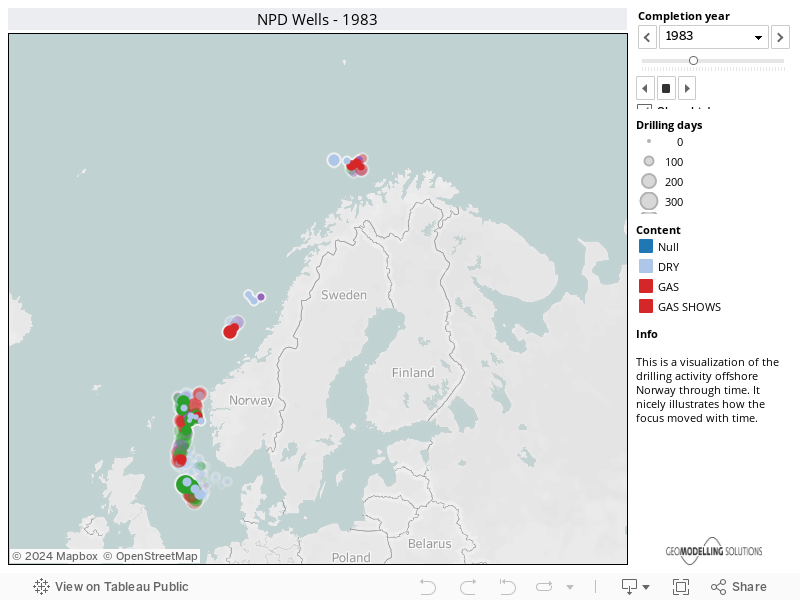
Here an example of an interactive data analysis in Tableau. This is a visualization of the drilling activity offshore Norway through time. It nicely illustrates how the focus moved with time. The data is from the Norwegian Oil Directorate, www.npd.no.